Trading Chart Drawing

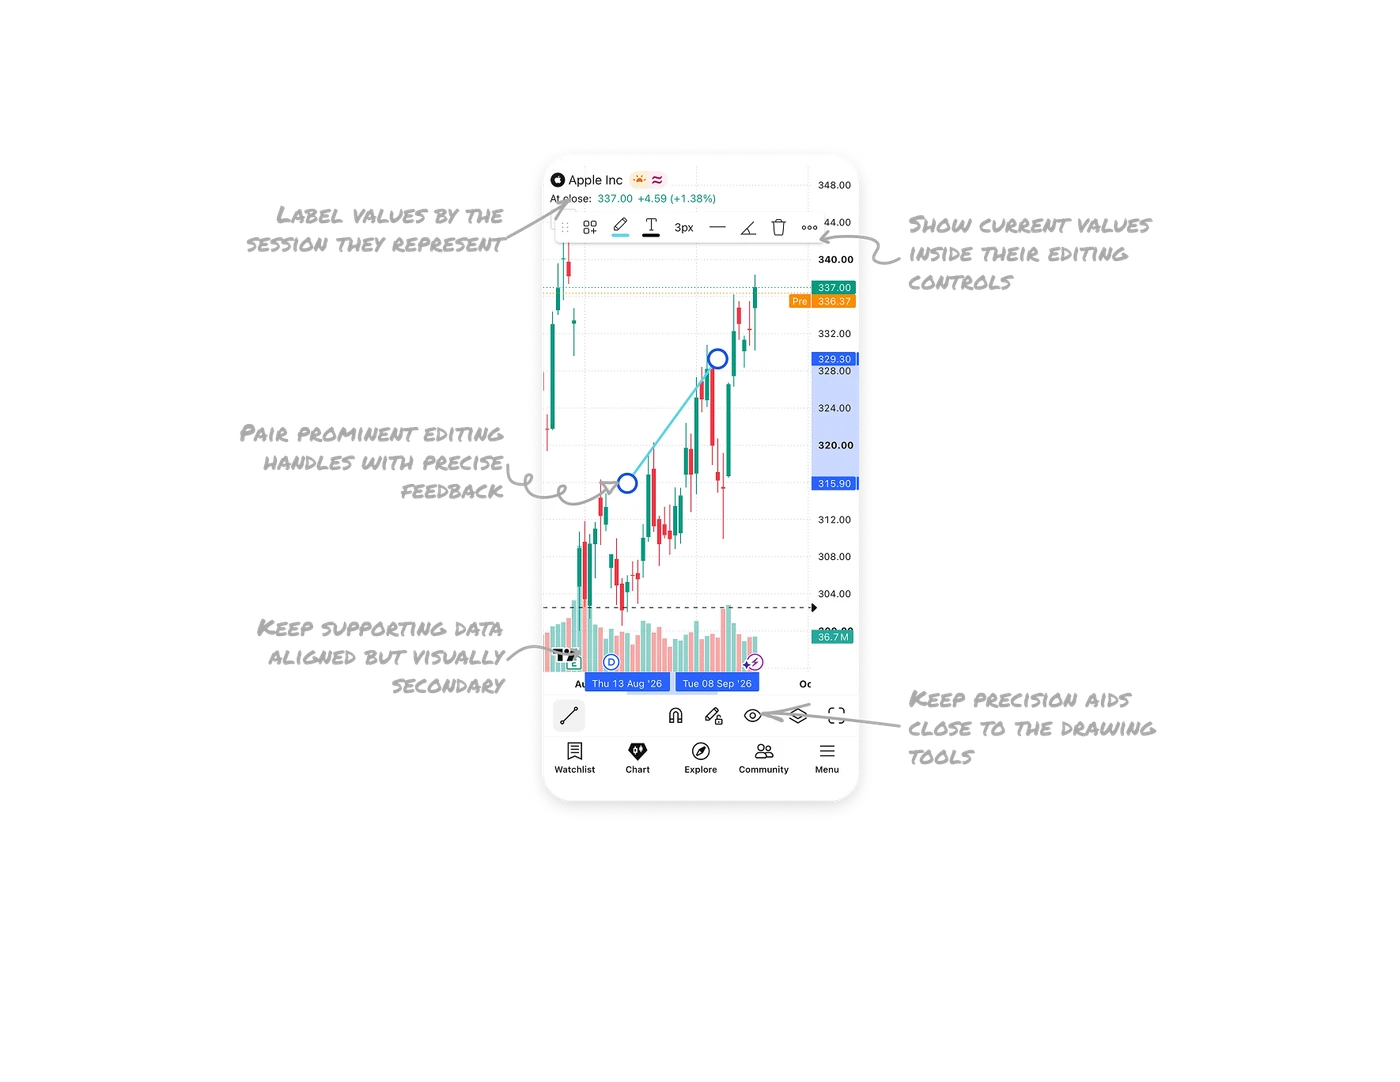
Pair prominent editing handles with precise feedback
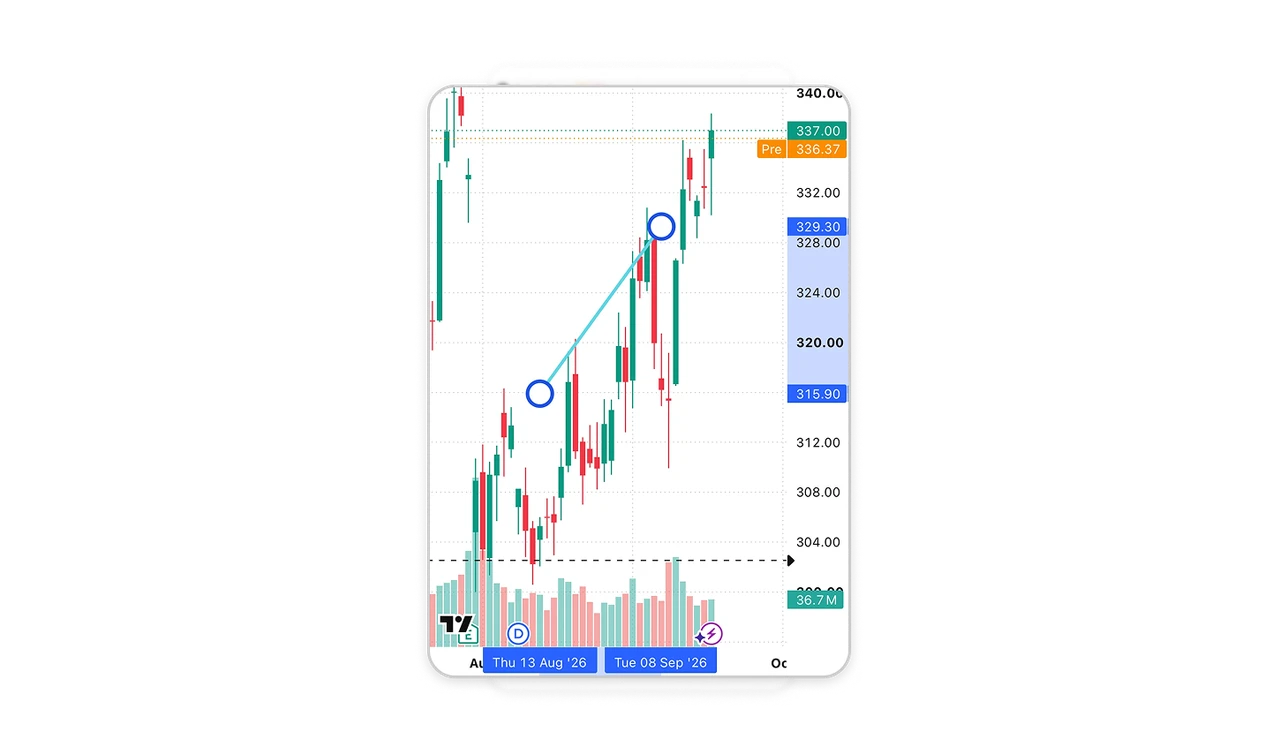
Large blue rings identify the selected line’s endpoints, while matching axis labels show their exact prices and dates. The handles remain visually prominent even though the line itself is thin. This pairs the practical needs of touch interaction with the precision chart users require. In mobile editors, size manipulation handles independently from the objects they control, then provide numerical feedback so users can check placement without judging it by eye.
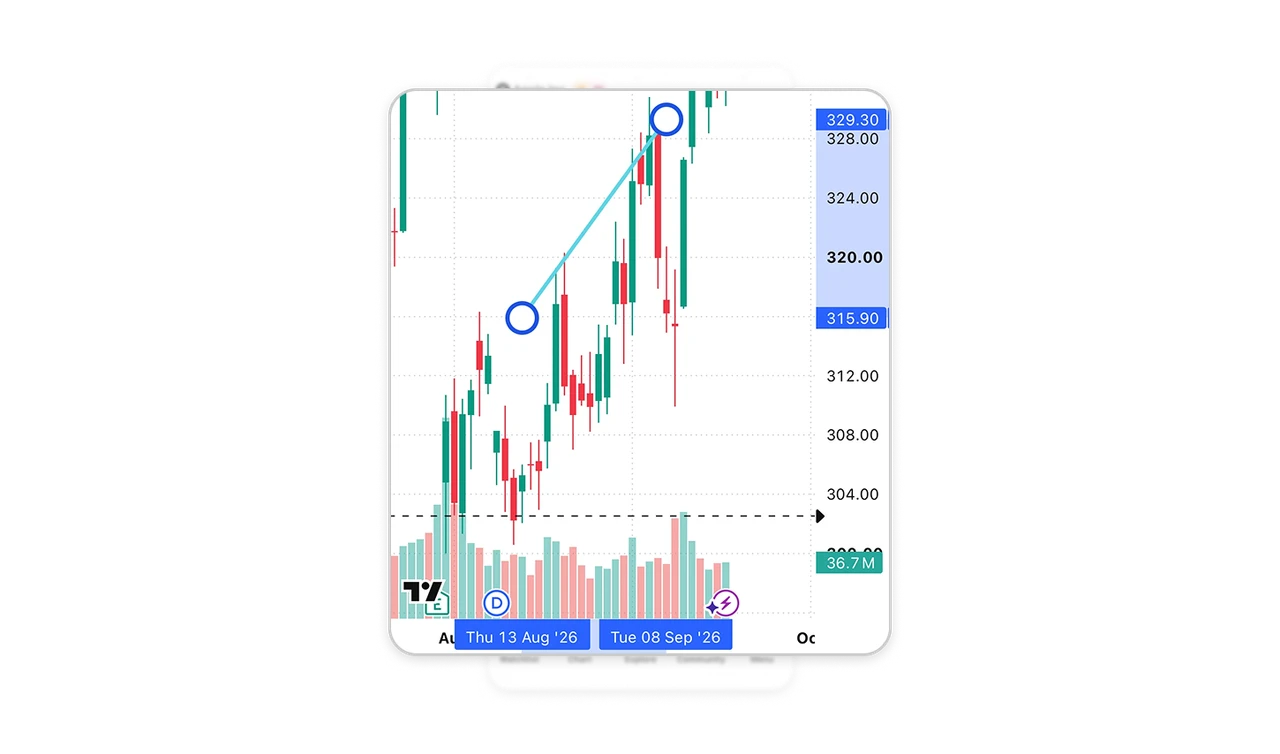
Show current values inside their editing controls
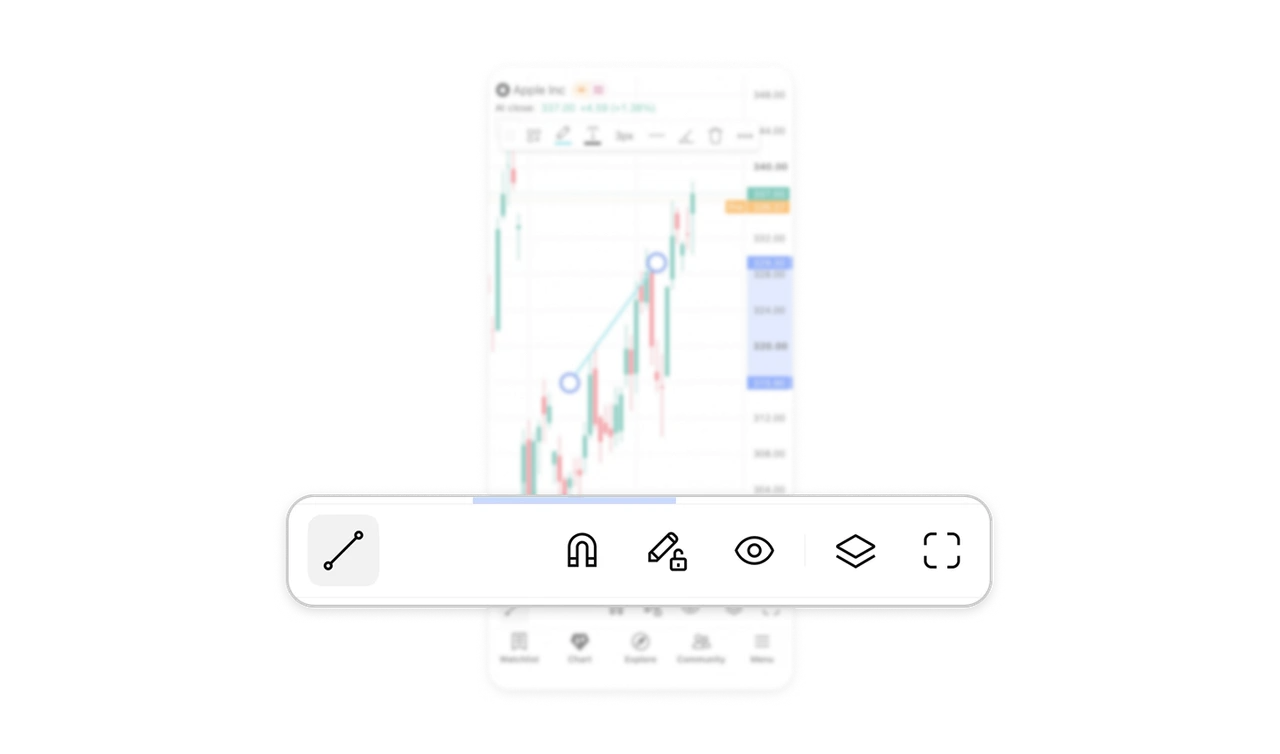
The pencil control carries a cyan swatch matching the selected line, while “3px” displays its width and the adjacent line sample previews its style. These controls expose the current configuration before any menu is opened. Keep important property values visible inside the controls that change them, especially in visual editors where users need to compare an object with its settings. The toolbar then supports both inspection and adjustment.
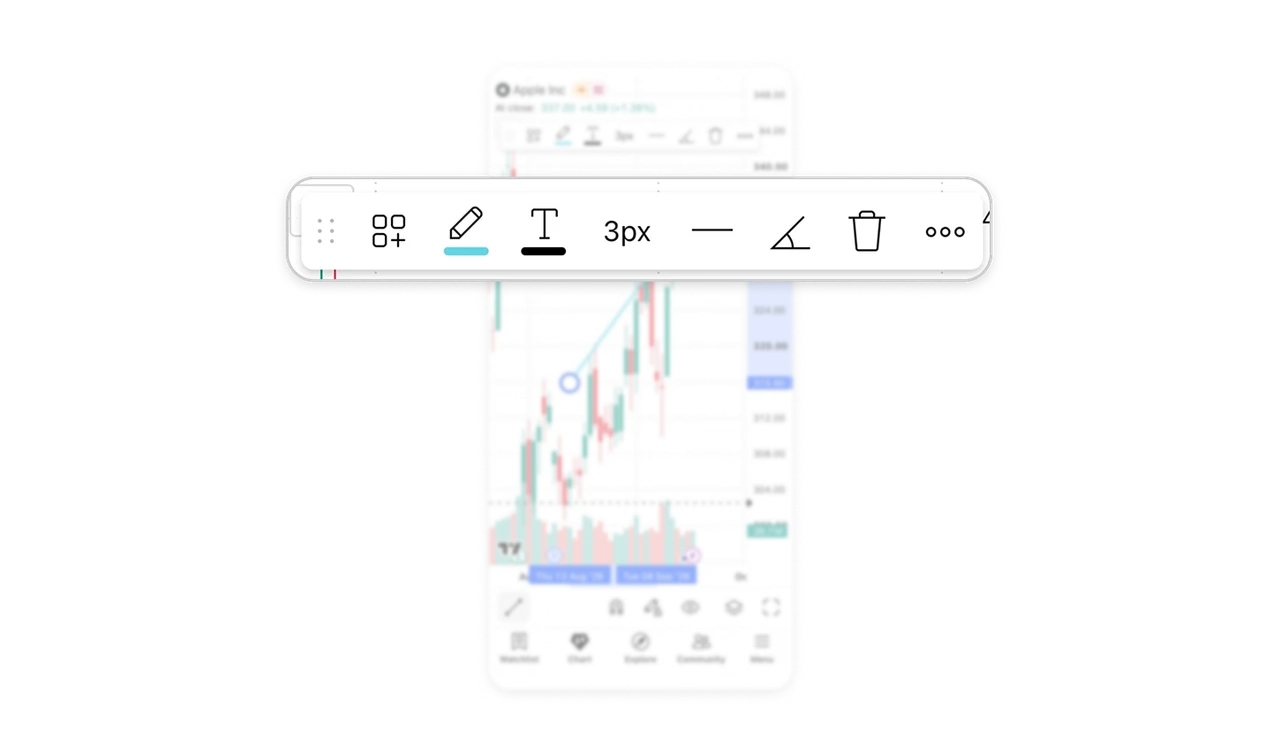
Label values by the session they represent
The quote header labels 337.00 as “At close,” while a separate orange marker labels 336.37 as “Pre.” Matching colors connect the horizontal price lines to their labels, while the wording distinguishes the sessions. For users comparing market activity, that context is part of the value itself. When related numbers represent different periods or states, attach that distinction directly to each number so users can interpret them together.
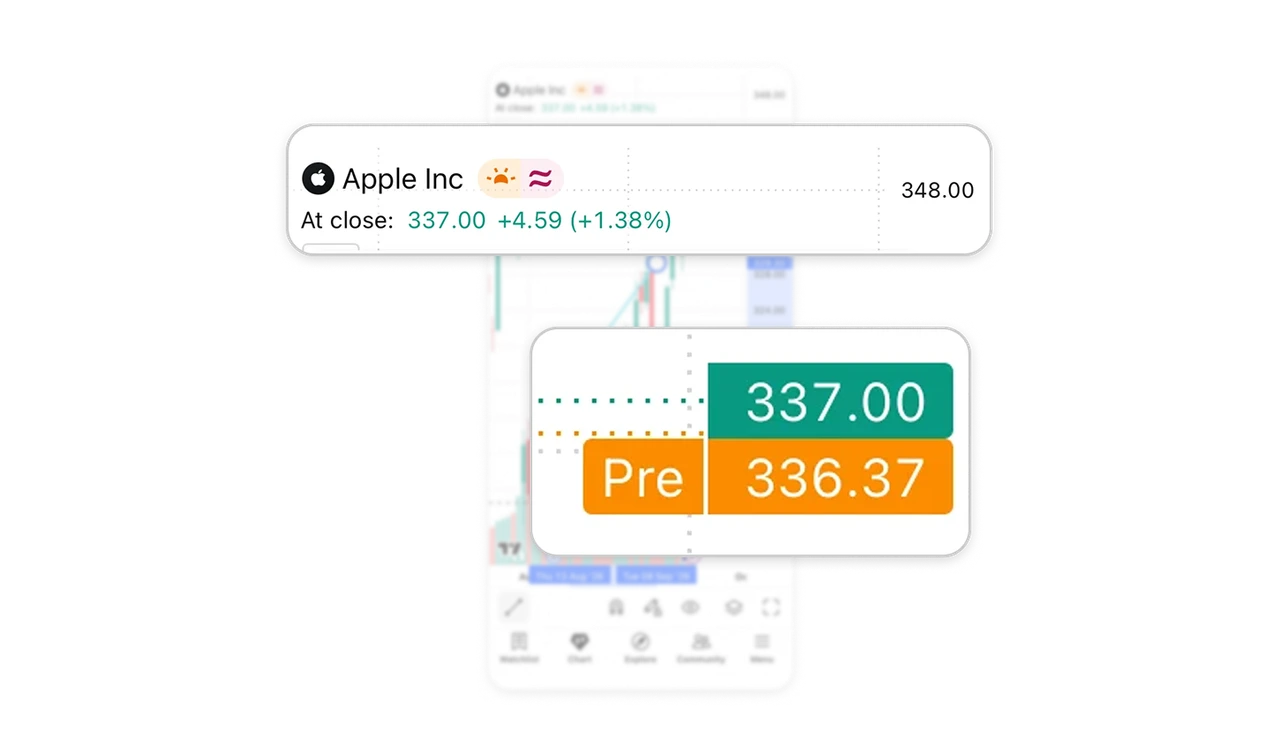
Keep precision aids close to the drawing tools
The chart’s lower toolbar places the drawing tool alongside magnet snapping, stay-in-drawing-mode, and visibility controls. These support recurring charting tasks: placing annotations against data, adding several drawings, and inspecting the chart with drawings hidden. Their grouping reflects what users need while working on the canvas. Design specialist interfaces around these recurring tasks, keeping precision and viewing aids accessible within the workspace where users apply them.
Keep supporting data aligned but visually secondary
Volume bars sit beneath the price candles, sharing their horizontal time alignment but using lighter colors. The price movement remains visually prominent, while users can compare it with trading activity at corresponding moments. Volume also has its own “36.7M” readout. When an audience routinely compares related measures, preserve their shared alignment and distinguish their visual weight and units so the supporting information stays useful without competing with the main plot.
Similar Breakdown Lessons